Alright, inspired by recent events, I’ve spent a bit (well, a lot) of time over the past couple months scratching an itch called “figuring out where in the US is safe from Armageddon.”
I had a lot of fun learning how to use a medley of QGIS features, learning where to find USGS GIS data, researching what targets the Russians/Chinese/French are are likely to target in a nuclear war, and learning how to render all this using Mapbox GL JS.
I’ve continued adding all this data as layers on my pet website bunker.land, and now if you want, you can map any of the risk layers I’ve added:
- Tornadoes
- Earthquakes
- Sea level rise
- Hurricanes
- Wildfires
- Possible targets in a nuclear war
But it’s time to wrap it up and ask an actual actionable question:
“Given these potential hazards —both natural and man-made — which US cities are the least prone to unexpected natural or man-made disaster?”
Rules
As a ground rule, I limited the list of towns/cities I’d evaluate to those with populations of 10,000 or more, for a couple reasons:
- 10,000 is a reasonable cutoff for “towns which have all the basic infrastructure for urban life” – grocery stores, restaurants, etc (your threshold may be wildly different, and you should feel free to filter the data differently.)
- Even mapping out cities of 10,000+ was computationally challenging — it took a full 24 hours for me to do the QGIS join I needed on this data. Mapping out towns of 1,000+ would have required a more sophisticated process.
Data
Before I get too deep, I want to be very clear about all the relative metrics used here: they are based only on my judgement. The raw data is all pretty well-sourced — I’m not fabricating any data points — but the weights of the relative risk bands are judgement-based. Interpret as you will.
First, I had four natural-disaster risk maps to parse: hurricanes, tornadoes, earthquakes, and wildfires. I broke each of these risk zones into 4 hazard bands, informally “low, medium, high, and very high.”
Earthquakes: I was able to fairly directly translate earthquake data into hazard bands based on the USGS input data. The units here takes a bit of work to wrap your head around (“peak acceleration as a % of gravity”), but it was easy enough to break this data into four bands: 10-20, 20-50, 50-70, and 70+
Wildfires: see this post for how I translated wildfire hazard data into discrete hazard bands. Lots of judgement involved.
Tornados: see this post for how I found tornado hazard zones.
Hurricanes: see this post for how I generated a hurricane risk map.
I assigned each of these zones a risk score. These scores are entirely judgement-based (although as I’ll discuss later, these scores don’t actually matter much for the purposes of this post):
- Low: 1
- Medium: 4
- High: 6
- Very high: 8
Second, there’s the list of plausible infrastructure targets in a nuclear war. For these purposes that means: military-capable airports, ports, military bases, state capitals, power plants (1+ GW), railyards, and nuclear missile silos.
I’ve used Alex Wellerstein’s NUKEMAP to judge “how close is too close” to a nuclear target. I went with a 5MT nuclear warhead (a standard Chinese ICBM loadout), which gives four hazard bands:
- Fireball: within 2km
- 5 PSI airblast: within 12km
- 3rd-degree burns: within 25km
- 1 PSI airblast: within 34km
Like with the natural disasters above, I assigned each of these zones a risk score:
- Fireball: 10
- 5 PSI airblast: 5
- 3rd-degree burns: 2
- 1 PSI airblast: 1
You can read a bit more about the methodology I used here.
If you want to do your own calculations, with your own weights, here are the raw layers I used, and the script I used to calculate weights (I know it’s a mess. It’s a personal project. Don’t judge me). You can reference this post for the script that turns the layers into the combined columnar cities.csv file.
Results
So, crunched all of the above data, and found…. 72 cities of 10,000+ people with no measurable risk, by those metrics. Here’s the map:
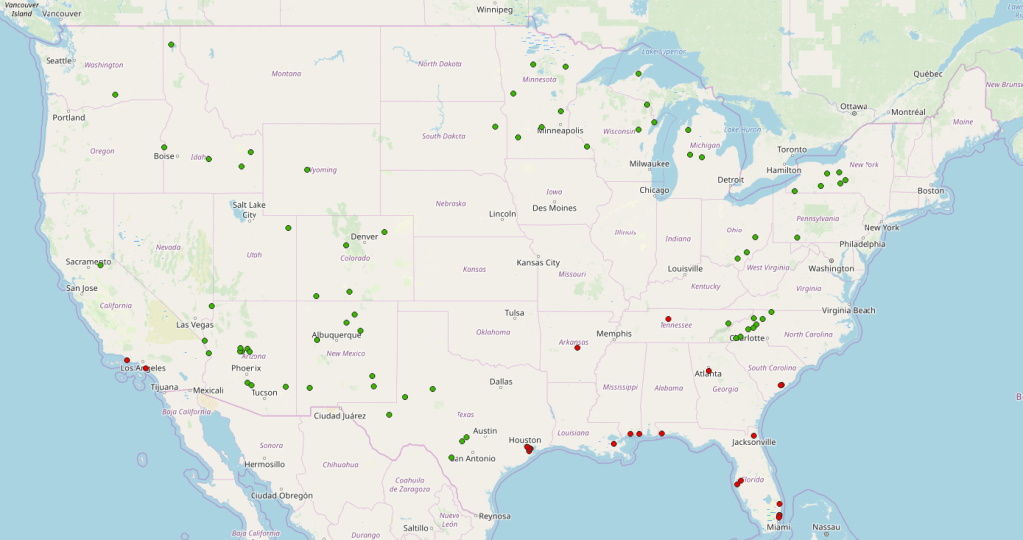
I’ve put a map of these cities on MapBox: you can explore the map here. I’ve also included the worst 25 cities for reference, but I’ll save that discussion for a later post.
Observations
In no particular order:
Most of the Midwest is entirely ruled out because of the risk of tornadoes. This may or may not be a reasonable bar, by your own judgement.
I had technical difficulties factoring flooding from sea level rise into these rankings. “Luckily”, coastal cities ended up being death-traps for unrelated reasons, so I didn’t need to do any manual fiddling to exclude them.
There were fewer low-risk cities in Idaho, Nevada, Utah, and Montana than I expected. Turns out, this is because:
- The area around Yellowstone has a meaningful earthquake risk. Given that Yellowstone is still an active supervolcano, this seems fair.
- A lot of areas in Idaho and Nevada are totally safe from a risk perspective, but simply don’t have any cities of 10,000+ people which register.
If you end up working through the data from scratch, note that I did remove three cities which only made the list because of bad data:
- Juneau and Anchorage. Turns out, these cities have a huge nominal footprint, so the “city center” is actually in the middle of nowhere. The real city centers are next to all sorts of important infrastructure (including a state capital). I removed these from the “safe” list.
- Newport OR is actually in a high-earthquake risk zone, but my map data puts the city in the middle of a river, which doesn’t register an overlap. Instead of fiddling with the data, I just removed it.
There are likely others — I’m not going to sort through the remaining 72 by hand, but be aware that there are probably flukes.
Largest cities
This is actually a longer list of cities than I anticipated: I thought I’d get 1-2 strangely isolated cities free of hazards, not 72. So we have a bit of leeway to interpret this data. The most straightforward question an urbanite would ask is,
“So what’s the largest city with no measurable hazards?”
We can answer that pretty easily. Here are the top 9:
| City | Population |
| Prescott Valley, AZ | 97,066 |
| Casa Grande, AZ | 58,632 |
| Ithaca, NY | 55,439 |
| Lake Havasu City, AZ | 55,341 |
| Traverse City, MI | 49,806 |
| Bullhead City, AZ | 49,531 |
| Roswell, NM | 49,119 |
| Maricopa, AZ | 46,741 |
| Prescott, AZ | 42,731 |
Now, here’s where I’m going to roleplay Solomon: I don’t care what this data says, nowhere — absolutely nowhere — in Arizona is a good place to ride out the apocalypse:
- Arizona is, at best, barely inhabitable without Air Conditioning. Global warming will only make this worse. There is absolutely no point in surviving a nuclear war only to burst into flames the second your HVAC loses grid power.
- Central Arizona is only hydrated by a gargantuan public works project. An entire river is pumped over the Buckskin mountains to keep the geriatric heart of Phoenix feebly beating. The minute a disaster strikes, Phoenix is going to be full of Sandworms and fremen raiding nursing homes to dessicate the elderly and steal their water.
- The few — very few — places in Arizona with natural water are along the Colorado river. If there’s a breakdown of law and order, Las Vegas is either going to (1) close the Hoover Dam and take all the water, or (2) get nuked and wash everything downstream of the Glen Canyon dam into Baja California.
So I am striking everything in Arizona from this list: Prescott Valley, Casa Grande (honestly, it’s a suburb of Phoenix, it’s just that the suburbs of Phoenix threaten to circle the earth) , Lake Havasu City, Bullhead City, Maricopa, and Prescott (why is this even distinct from Prescott Valley?)
Which leaves 3 cities.
The winners
This leaves us three cities which are (1) fairly large, (2) sheltered from natural disasters and (3) have absolutely nothing worth destroying:
- Ithaca, NY
- Traverse City, MI
- (I promise I did not tamper with the data to get this) — Roswell, NM
Ithaca
Ithaca was a bit surprising, but it’s reasonable in retrospect:
- As a college town, Ithaca is reasonably large, driving it to the top of this list
- As far as I can tell, it has no industry whatsoever
- Although New York City is a Big Deal, upstate New York is pretty empty overall. There’s really not much in the area that shows up in the target maps I generated:
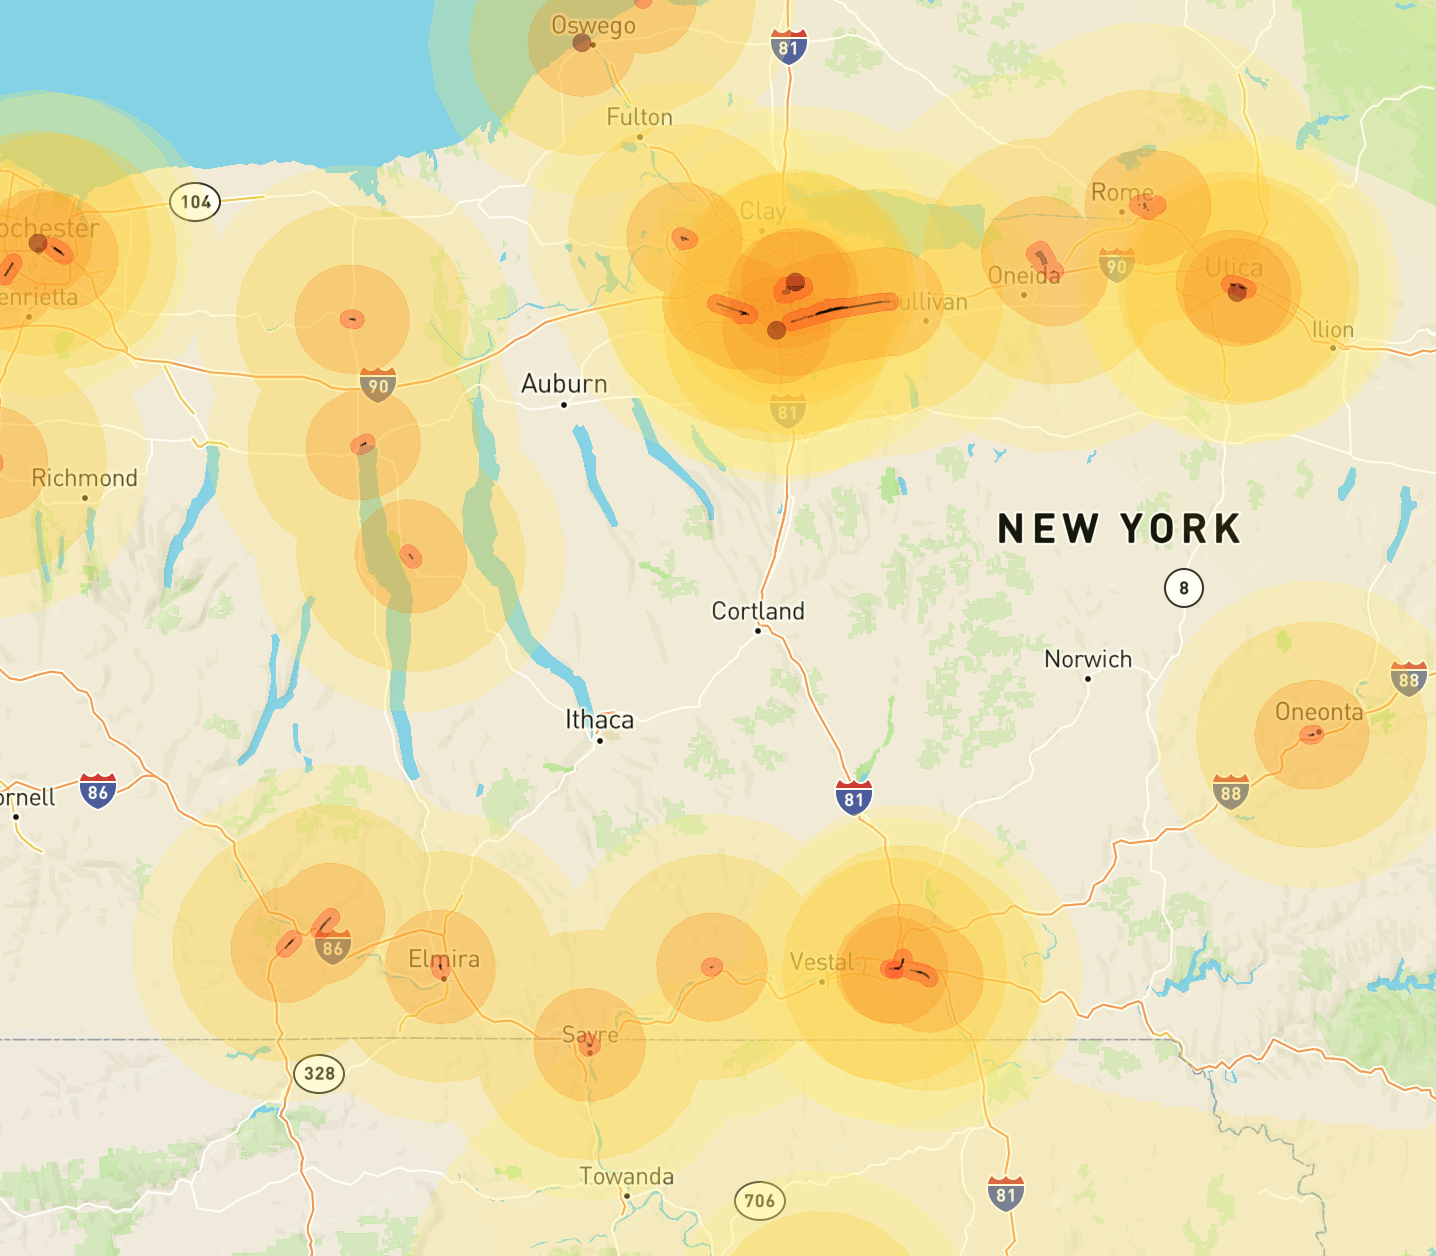
So… not what I expected, but seems reasonable overall.
Traverse City
I have never heard of Traverse City MI before. After reading the Wikipedia page, I have learned that “the Traverse City area is the largest producer of tart cherries in the United States”. Apparently that is about it.
There are some military bases in the general area, but nothing that registers in the 34km buffer:
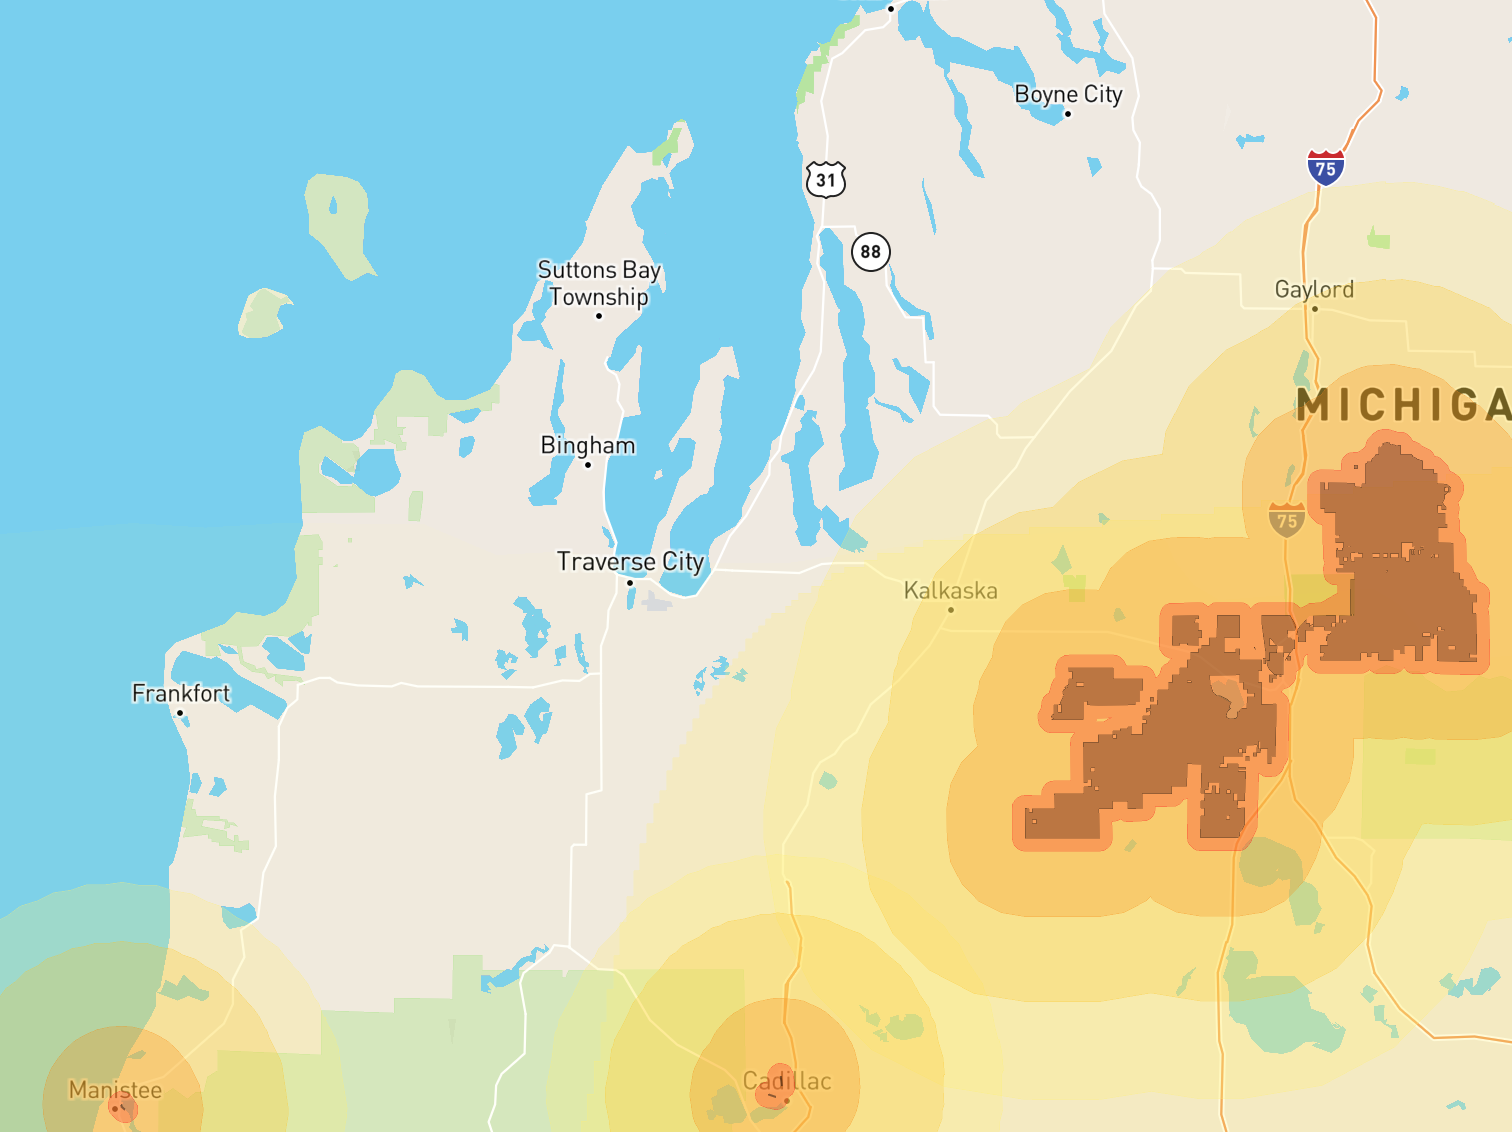
I have very little else to say about Traverse City, except that it seems safe from disaster.
Roswell
I will be honest: I’ve always thought of Roswell in the context of UFO jokes, and never really considered that Roswell is a real city, full of real people, living real lives.
It turns out that it is a real city, but the largest industry is “Leprino Foods, one of the world’s largest mozzarella factories”, which is likely not a first-strike military target. It also turns out that the infamous Roswell Air Force Base closed in the late 60s, so there are no longer any military targets in the vicinity.
In fact, the closest risk of any significance, by these metrics, is a wildfire hazard zone to the east:
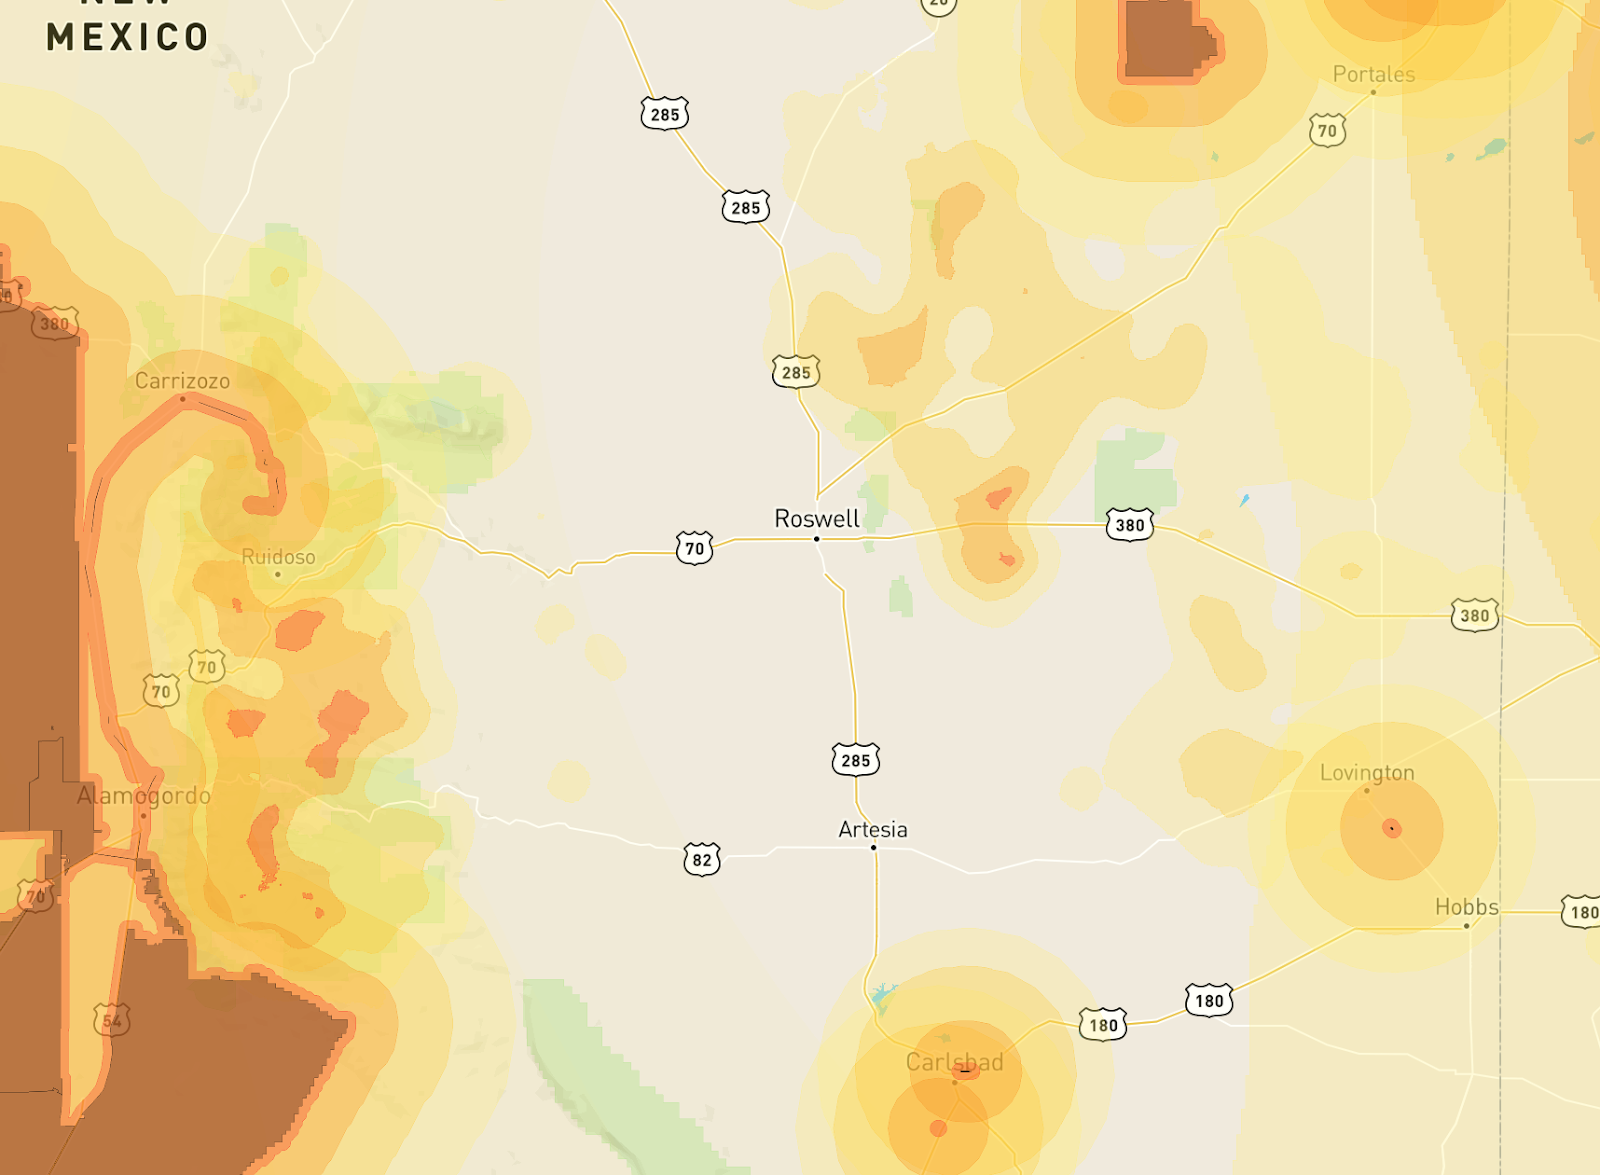
So Roswell, alien jokes aside, actually registers as the third-largest city utterly* safe from natural or man-made disaster.
*well, as best as I can figure.
Conclusions
I tried pretty hard to not pre-register expectations so I wouldn’t unconsciously bias my results. So I don’t have anything interesting to say, like “that’s exactly what I expected” or “wow, I thought city XYZ would make the list!”
I feel pretty good about these results because:
- They are geographically diverse. It’s not all in some weird cluster because of bad data.
- I didn’t end up having to draw an arbitrary cutoff. 72 is a good number of cities to greenlight.
- Roswell is #3, which I still find hilarious.
I’ll do one last followup post with the worst-25 cities by these metrics. Spoiler alert: it’s mostly the gulf coast and LA. But I’ll hopefully have that up in a week or two.
